The 2026 Nobel Prize in Economics, explained

Who steers the economy?

Every few years the economy swings. Sometimes shops are packed and prices climb fast. Sometimes shops close and people lose their jobs. Most countries have a special bank, the central bank, whose job is to calm these swings. In the 1970s, the rules it used to decide what to do suddenly stopped working.

In one line

Robert Hall and Michael Woodford helped build a new model of the economy from how ordinary people and shops decide, including what they think will happen next. Central banks around the world now use this kind of model to set their interest rates.

Short on time? Read the 5 key things or jump to the game. Want all six 2026 prizes? See the Nobel Prize guide.

Start here

The whole story in six pictures

If you only look at one thing on this page, look at this.
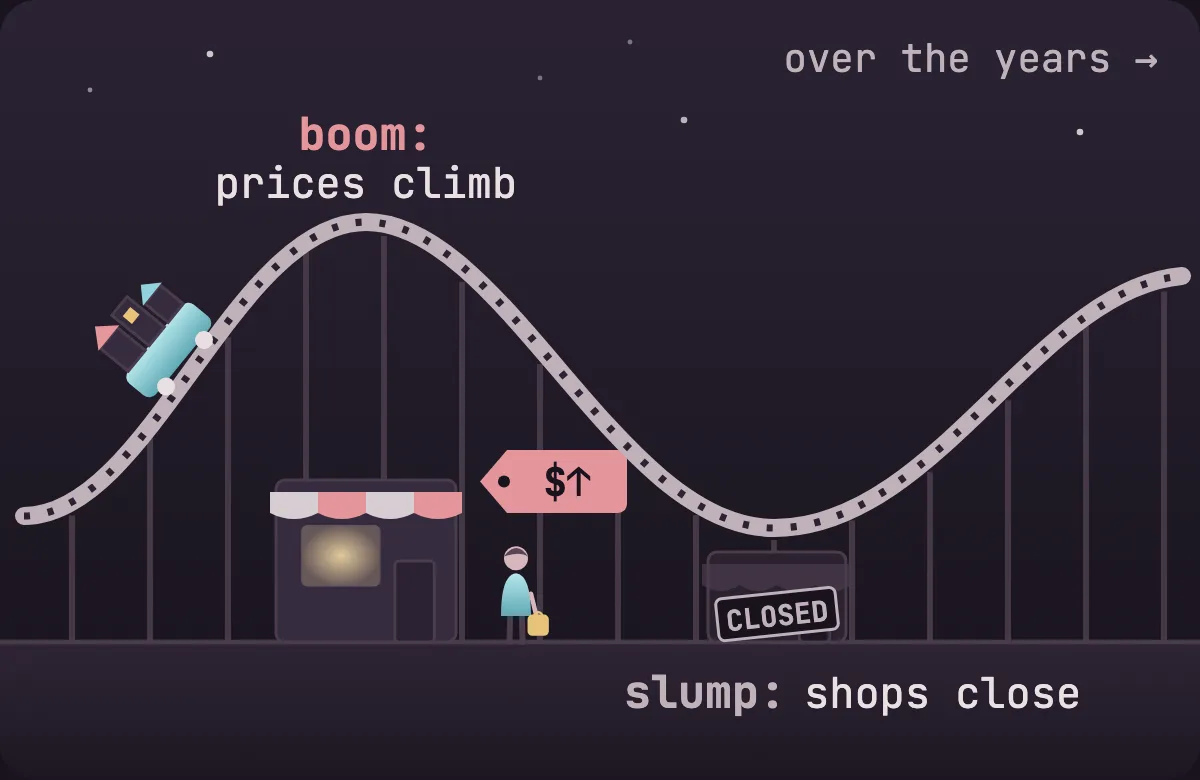
A little town riding a roller-coaster track over the years: a peak labelled boom, prices climb, and a dip labelled slump, shops close 1 · The ride

The economy swings between booms, when prices climb, and slumps, when shops close and jobs disappear.
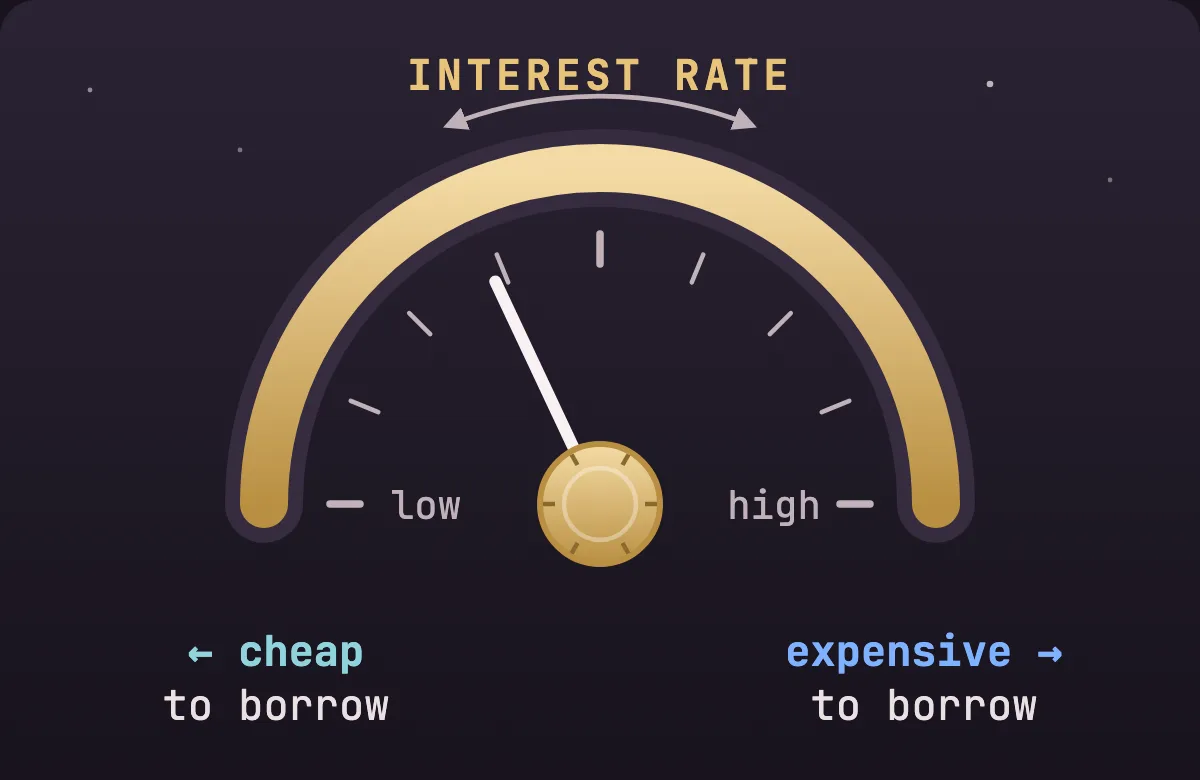
A gold interest-rate dial: turned one way borrowing is cheap, turned the other way borrowing is expensive 2 · The dial

A country’s central bank tries to smooth the ride by making borrowing cheaper or more expensive.
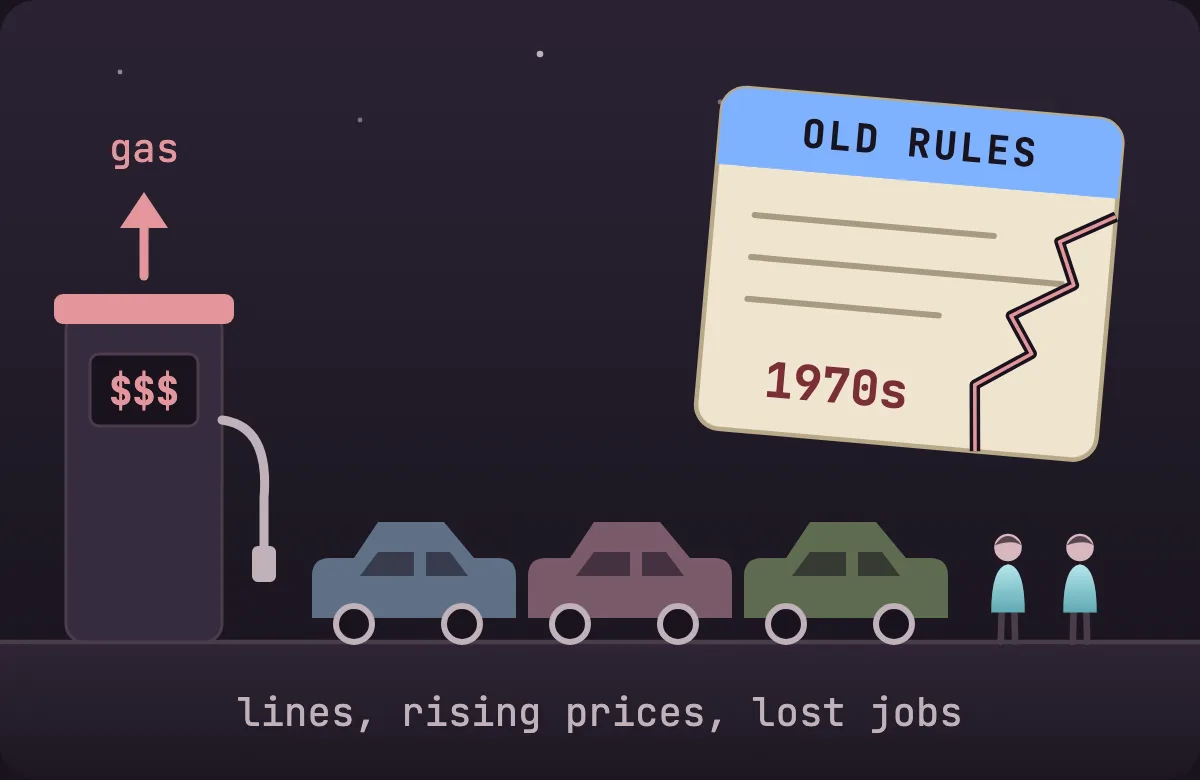
The 1970s: a gas pump with rising prices, a line of cars and a cracked card labelled old rules 3 · The 1970s

The old rulebook for setting the dial was built on patterns in past numbers. In the 1970s those patterns broke.
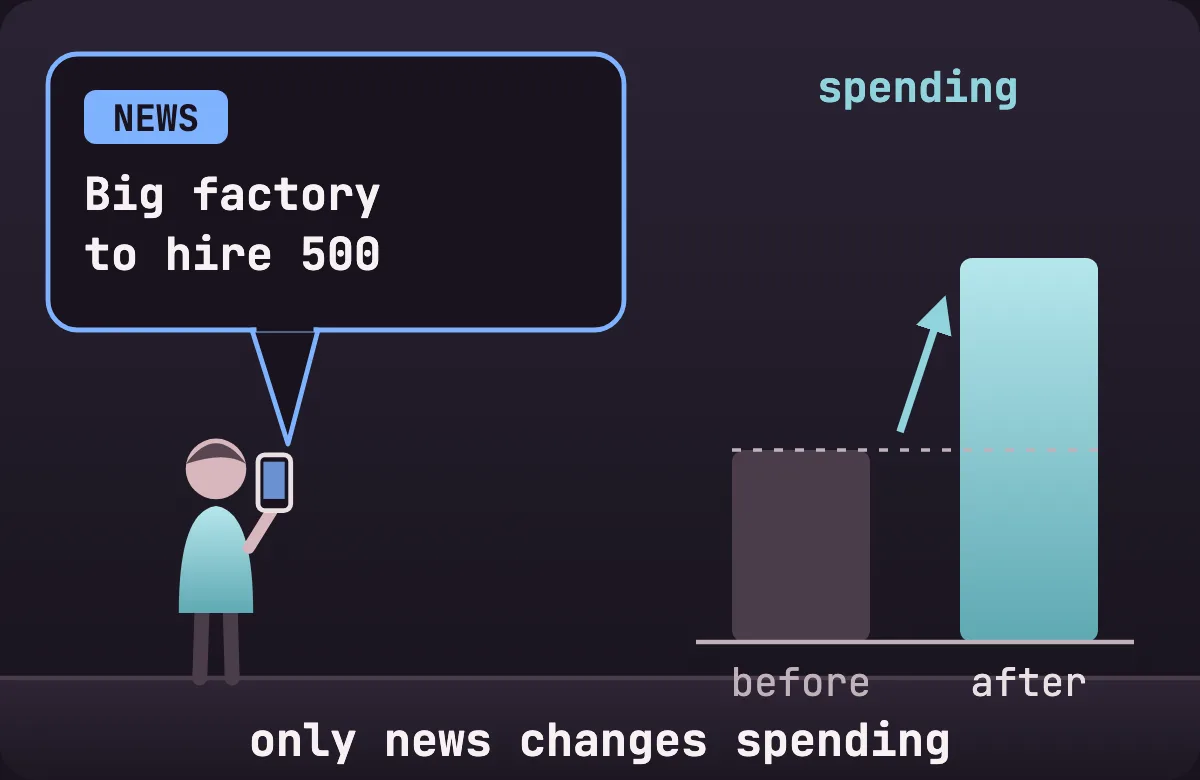
A person reading a news headline on their phone, and their spending bar changing: only news changes spending 4 · Hall, 1978

Robert Hall showed that people change what they spend when news changes how they see their future.
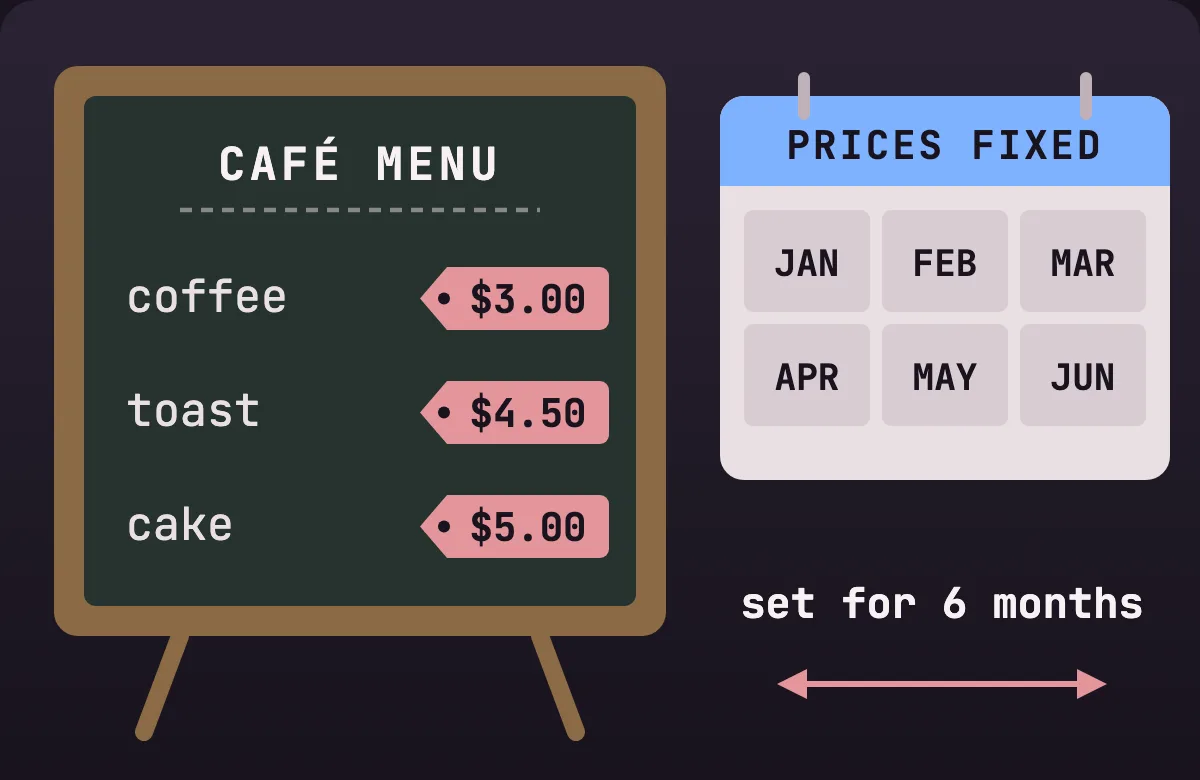
A café chalkboard menu with prices fixed for six months, next to a calendar 5 · Woodford, 2003

Michael Woodford built the model with shops that fix their prices for months, so they look ahead when they set them.
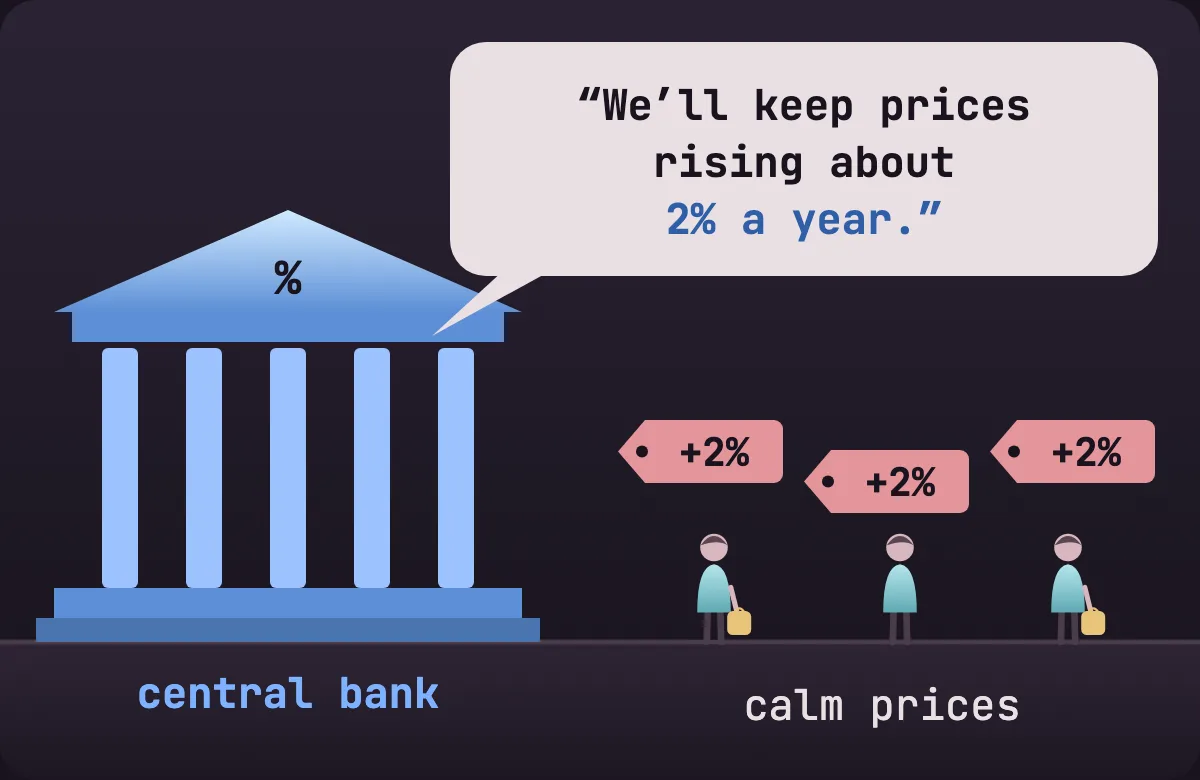
A central bank building saying “We’ll keep prices rising about 2% a year”, with calm +2% price tags 6 · Steering with words

So a central bank steers with clear, believable promises as well as with the dial.

Chapter 1

Why the economy goes up and down

In 2022, prices in the US rose faster than at any time in 40 years. Then the people in charge did something that sounds backwards: they made loans more expensive on purpose. To see why, we first need to know what “the economy” is and why it swings.

  1. Step 1The economyThe economy is all the buying, selling and working that goes on in a country. You buy bread. The baker uses your money to pay her staff and buy flour. The staff spend their pay at other shops.
  2. Step 2Spending is paySo one person’s spending is another person’s pay. When people buy more, shops need more staff, and those staff have more to spend. When people buy less, the same chain runs backwards.
  3. Step 3PricesShops also change their prices. When prices across the board keep going up over time, that is called inflation, measured in % a year. Prices rising about 2% a year counts as calm. Prices rising 9% a year means $100 of shopping today costs about $109 a year later.

Nearly a century ago, the British economist John Maynard Keynes pointed out a simple problem. Shops and factories can only make so much, limited by their staff and machines. But how much people want to buy swings up and down with how confident or scared they feel and how easily they can borrow. So the total amount people want to buy doesn’t automatically match what a country can make.

When people want to buy much less than shops can make, shops sell less and cut staff. Those people now have less pay, so they buy less too, and the downturn feeds itself. A bad time like this is called a slump. When the economy actually shrinks for a while, it’s called a recession, and the share of people who want a job but can’t find one, called unemployment, goes up.

shops sell lesscut staffpeoplebuy lessthe slumpfeeds itself

When people want to buy much more than shops can make, the shops can’t keep up. Lines form and shelves empty, so shops raise their prices. Their staff ask for higher pay to keep up, and prices rise again. A hot time like this is called a boom. When it goes too far, economists call it overheating, and it shows up as high inflation.

Keynes’s answer was that someone should step in: speed buying up in a slump, and slow it down in a boom. Evening out the swings like this is called stabilisation policy, and today the main “someone” is the central bank (chapter 2). Try both extremes in the toy town below.

youbakerstaffyou buy bread$pays staffstaff buythingsspending =someone’s pay

Jobs: 95%·Prices rising: 2% a year

Just right. People buy about what the town can make: almost everyone has a job, and prices rise a calm 2% or so a year.

Curious? Go deeperWho decides that a recession has started?

It depends on the country. In the US, a small committee of economists at the National Bureau of Economic Research looks at jobs, spending, income and production, and names the month when a slump began and ended. One of this year’s winners, Robert Hall, chaired that committee for decades. In the UK and many other countries, news reports use a simpler rule of thumb: a recession is when the economy shrinks for two three-month periods in a row.

Curious? Go deeperWhy aim for prices rising 2% a year, and not zero?

A little inflation leaves some safety room. If prices start falling, people tend to wait for things to get cheaper, shops sell less, and a slump can deepen. Official price measures also tend to overstate inflation slightly, because products keep getting better. So most big central banks aim for prices rising about 2% a year: low enough that nobody has to think about it, but not so close to zero that prices tip into falling.

Key idea

When people want to buy much less than a country can make, jobs disappear. When they want to buy much more, prices climb. Smoothing out those swings protects both your job and what your shopping costs.

Quick check

People suddenly want to buy much more than the shops can make. What happens?

Chapter 2

The dial that speeds up or slows down spending

The one who steps in is usually the central bank. To make millions of people buy more or less, it turns one number up or down, like a dial: the interest rate.

Interest is the extra you pay when you borrow money, or the extra you earn when you save it. It’s given as a % of the amount each year, called the interest rate. Borrow $100 at 5% and you pay $5 a year on top. Save $100 at 5% and you earn $5 a year.

Most countries have a central bank, a “bank for the banks”, such as the Federal Reserve in the US, the Bank of England or the European Central Bank. It isn’t the bank where you keep your account. It sets one main interest rate, called the policy rate. Ordinary banks borrow from the central bank and from each other at about that rate, so when it goes up, their costs go up, and they pass that on in the rates they charge on loans and pay on savings.

BORROW$$$$1005% a year$you pay$5 a yearSAVE$$$$1005% a year$you earn$5 a year

Here’s how that number steers spending. When the central bank lowers the rate, loans for cars, houses and new machines get cheaper, and keeping money in savings earns less, so waiting to spend is less rewarding. So people and businesses spend more now. When it raises the rate, loans cost more and saving pays better, so people spend less and save more.

Somewhere in the middle is a rate that neither speeds spending up nor slows it down, called the neutral rate. Above it, the dial brakes; below it, the dial speeds things up. Turn the dial below and watch one family’s choice, and then the whole town.

Interest rate

A family wants a $20,000 car

Car loan: $359 a month

Buy now
Wait and save

In the middle: it could go either way.

Shopping in town100%
what the town can make
Months later… About right: the town buys what it can make.

Turn the dial. Cheaper loans make people buy more, more expensive loans make them buy less, but the change reaches the shops only months later.

The dial also acts slowly. People don’t rush out to buy a car the day after rates fall, and businesses take months to plan a new factory. So a change in the rate takes many months, often a year or more, to be fully felt. It’s a bit like a shower tap in an old house: you turn it, and the water takes a while to change temperature. If the central bank turns the dial too late or too hard, it overshoots, and a boom can tip into a slump.

Curious? Go deeperDoesn’t the central bank just print money and hand it out?

A central bank doesn’t send money to people. Its everyday tool is the interest rate. In emergencies, such as after 2008 and in 2020, some central banks also bought huge amounts of government and company debt, which pushed down the interest rates on long-term loans such as mortgages. That money went into the financial system, not into people’s pockets. Payments to households, such as pandemic checks, come from the government, which has its own lever: taxes and payments.

Key idea

The central bank speeds spending up by making borrowing cheaper, and slows it down by making borrowing more expensive. The effect arrives slowly, like a shower tap.

Quick check

Why would a central bank raise its interest rate?

Chapter 3

The day the old rulebook broke

If steering is just turning a dial, why did it take a Nobel Prize? Because you have to know how far to turn it, and when. For that, central banks need a rulebook that predicts what the economy will do next. Economists call such a rulebook a model.

The first models were built by looking at past numbers and copying the patterns, as if they were fixed laws. One pattern said that when lots of people were out of work, prices stayed calm, and when almost everyone had a job, prices rose faster. Economists drew it as a line called the Phillips curve. Another pattern said that people spend a fixed share of whatever they earn this year. (Robert Hall, one of this year’s winners, later tested that idea. That’s chapter 4.)

Those patterns made the dial easy to set. Want more jobs? Push spending up and accept a little more inflation. For about twenty years after the Second World War, that seemed to work.

The old rulebook

When lots of people are out of work, prices stay calm.

1969

interest rate: nearly 20%
5.5%
2% = calm
Prices rising% a year
3.5%
People out of work% of workers

1969. Few people out of work, and prices rising a bit faster. That fits the old rulebook: when one goes up, the other goes down.

1969. Few people out of work, and prices rising a bit faster. That fits the old rulebook: when one goes up, the other goes down.

1975. Oil prices jumped in 1973. Prices rose fast and more people were out of work, both at the same time. The old rulebook said that couldn’t happen.

Early 1980s. To stop prices racing, the US central bank pushed its interest rate to nearly 20%. Price rises slowed, but people out of work climbed to about 1 in 10.

Then, in 1973, oil prices suddenly jumped to about four times what they had been. Oil runs factories, trucks and heating, so almost everything got more expensive to make and move. Businesses raised their prices to cover the extra cost, and some made less and cut staff. So prices rose fast and people lost their jobs, at the same time. The old pattern said that couldn’t happen. This mix got its own name: stagflation, a stalled economy plus inflation.

The old rulebook only knew one kind of slump: people buying too little, so shops sell less and cut staff. Its fix was to push spending up, by keeping interest rates low and having governments spend more. The goal was to bring jobs back: more customers means shops sell more and hire again. That works when shops have staff and machines standing idle, waiting for customers.

But this slump was a different kind. People hadn’t stopped buying. Making things had got more expensive. Extra spending can’t make oil cheaper, so shops and factories couldn’t make much more, however many customers came. When governments and central banks pushed spending up anyway, the extra money mostly pushed prices even higher, and the jobs still didn’t come back. The problem was costs, not too little buying, so the old fix aimed at the wrong thing.

After years of rising prices, people started to expect more of the same. Workers asked for bigger raises to keep up, shops raised prices again to pay them, and inflation fed itself. A second oil jump in 1979 made it worse. In the US, high inflation was finally brought down in the early 1980s, after the central bank raised its rate to around 20%, which made loans so expensive that people spent much less. Price rises slowed, but the cost was a deep recession, with unemployment above 10% by the end of 1982.

Why did the patterns break? An earlier winner of this prize, the economist Robert Lucas (1995), gave the main answer. Patterns in past numbers only show how people behaved under the conditions of that time. For example, when prices had been steady for years, shops rarely raised prices in hard times. Once everyone had lived through years of 10% inflation, shops raised prices anyway, because they assumed everyone else would. People had changed how they behave, so the old pattern vanished.

His fix was to build the model from the bottom up: start from how single households decide what to spend and how single businesses set their prices, then add them all together. Economists call the small scale micro (one person, one shop) and the whole country macro. That is what the prize’s official wording means: “microeconomic foundations of macroeconomic stabilisation”. Building such a model that was also simple enough to use took economists decades, and it’s what Hall and Woodford helped do.

micro: one shopmacro: whole townbuild the big picturefrom the small decisions
Key idea

Rules copied from past numbers broke in the 1970s, when prices and job losses rose together. Economists needed a model built from how real people and shops decide.

Quick check

What did the 1970s show that the old rulebook said couldn’t happen?

Chapter 4

People change their spending on news

Building the economy from the bottom up starts with the biggest piece: what households spend. In most countries, household spending is the largest share of all buying. So how do people decide how much to spend?

Economists already had a good guess. Most people don’t spend just based on this month’s pay. They spend based on what they expect to earn over the coming years. Economists call what people think will happen their expectations. A student who expects a well-paid job soon may spend more than her pay. Someone who fears a layoff cuts back even before it happens.

The trouble was proving it. You can measure what people earn and spend, but you can’t see what they expect. Researchers spent years hunting for clues that would predict how people’s spending would change, and the clues kept failing.

In 1978, Robert Hall at Stanford University turned the problem upside down. Suppose you already spend based on everything you expect, including a raise you know is coming next spring. Then your spending today already includes it, and the raise arriving changes nothing. You only change your spending when something new happens: a surprise promotion, a layoff, a scare in the news. And news, by definition, can’t be predicted from the past, or it wouldn’t be news.

So the test was the opposite of what everyone had tried: if the theory is right, nothing in the past should predict whether people will spend more or less next year. Hall checked the numbers, and the data largely agreed with him. The Nobel committee calls it “something of a eureka moment” for the field.

Hall’s idea also gave a yardstick. Some changes in spending could be predicted after all, and they came from households with no savings who can’t borrow. Those households can’t plan for the years ahead, so they spend money as soon as it arrives. Their spending follows their pay, and pay days are known in advance, so their spending can be predicted. We’ll call them pay-to-pay households (economists say “hand to mouth”), and the others planners. In 1982 Hall and Frederic Mishkin used records from real families to estimate the split: in their data, about 2 in 10 households lived pay to pay and 8 in 10 behaved like planners. The table below shows what each kind of household does with the same news.

The newsPlannerhas savings, plans aheadPay-to-payno savings, spends what arrives
A one-off $1,000 gift↑ a tiny bitabout $10 more a month, for years↑↑ most of it nowabout $750 more this month
A lasting raise↑ more every monthfrom now on↑ more every monthfrom now on
News: layoffs rumoured↓ cuts back noweven though pay hasn’t changed yet— no change yetpay hasn’t changed, so spending hasn’t either

The planner reacts to news about the future. The pay-to-pay household reacts to money arriving. In Hall and Mishkin’s 1982 data, about 8 in 10 households acted like planners and 2 in 10 lived pay to pay.

Curious? Go deeperWhy does the split between planners and pay-to-pay households matter?

Because it changes what a government payment does. Give everyone a one-off $1,000 and the planners spread it over the coming years, while pay-to-pay households spend most of it straight away. So a one-off payment boosts spending mostly through the households with no savings. A lasting change, such as a permanent tax cut, changes what planners expect too, so they spend more as well. Many of today’s central-bank models include both kinds of household for exactly this reason.

Key idea

Planners, most households, change what they spend when news changes their picture of the future. So expectations drive spending, and a good model has to include them.

Quick check

A planner hears that their job is safe and a raise is coming next year. When does their spending change?

Chapter 5

Shops set their prices looking ahead

Hall explained spending. The next piece is prices: how shops decide them, and why prices can keep climbing once everyone expects them to. This is where Michael Woodford comes in.

Think of a café. It can’t print a new menu every morning. Changing prices takes time and money, and customers hate it. So the café changes its prices only now and then, maybe once or twice a year. Economists call these sticky prices.

Because the café is stuck with its price for months, it has to look ahead when it sets one. If the owner expects milk, rent and other cafés’ prices to rise over the coming months, she sets a higher price now. So what businesses expect drives prices, just as what households expect drives spending.

MENUcoffee$3toast$4ONE YEARJFMAMJJASOND= new prices printedonly twice a year

In 2003, Woodford (then at Princeton University, now at Columbia) put all the pieces together in a book called Interest and Prices. His model has three parts: households that spend based on what they expect (Hall’s result), businesses with sticky prices that look ahead, and a central bank that sets the interest rate. The Nobel committee calls it “a kind of laboratory for policymakers”: you can ask it what happens to jobs and prices if the rate goes up from, say, 3% to 4%, before trying it on a real country.

This kind of model is called New Keynesian: Keynes’s old idea of steering, rebuilt on the choices of real people. In it, as in real life today, the central bank steers by setting the interest rate.

Why a promise can steer as well

The model has a striking consequence. Since shops and households look ahead, what the central bank is expected to do matters as much as what it does today. If everyone believes the central bank will keep prices rising only about 2% a year, cafés don’t raise prices “just in case”, workers don’t demand big raises “just in case”, and inflation stays calm. If nobody believes it, everyone raises prices to protect themselves, and inflation feeds itself.

That’s why central banks today publish an inflation target (usually 2% a year), explain their reasoning in public, and say what they plan to do next. People believe a central bank when it has kept its word before, for example by raising rates when inflation rose, even though that was unpopular. Being believed has become one of its most important tools.

So the new idea has two parts. First, people and shops look ahead: what they expect to happen to prices and interest rates changes what they do today. Second, that means a central bank steers with two things, not one: the interest rate it sets today, and what people expect it to do next. The picture below shows one café’s coffee price over two years, both ways.

Curious? Go deeperWhat can a central bank do when the rate is already zero?

After the 2008 financial crisis, many central banks cut their rates to almost zero and still needed more spending. They couldn’t go much lower. (Below zero, people could just hold cash instead of paying the bank to keep it.) In 2003 Woodford and Gauti Eggertsson had worked out a way out, in theory: a believable promise to keep rates low for a long time, even after the economy recovers. If people believe it, long-term loans such as mortgages get cheaper right away, and businesses and families plan on cheap borrowing ahead, so they spend more today. This is called forward guidance. After 2008, the US central bank and others began saying how long they expected to keep rates low, and that kind of statement is now a standard tool.

Key idea

Shops fix their prices for months, so they set them looking ahead. If people believe the central bank’s promise to keep inflation low, prices calm down faster.

Quick check

Why does a believable promise from the central bank help keep prices calm?

Chapter 6

Does it work? Back to 2022

So did the new model help? Remember the puzzle from the start: in 2022, prices rose faster than in 40 years, and central banks made loans more expensive on purpose. Here’s why.

Some shocks don’t start with what people want to buy. They start with what the economy can make. A jump in energy prices, or factories and ports shut by a pandemic, suddenly cuts how much can be made. Economists call this a supply shock. It’s the kind of slump that hit in the 1970s (chapter 3), and again in 2021 and 2022, alongside strong spending as countries reopened after the pandemic.

Woodford’s model shows what happens next. People may buy a little less, but what the economy can make falls even more. So there is still more buying than the economy can make without straining, just like the boom in chapter 1. In the model, the size of that mismatch is called the output gap. When buying is above what can be made, prices are pushed up. At the same time, businesses that rely on energy are hit first and cut staff, so some people lose their jobs even though total buying is still high.

beforeafterbalancedbuying > what can be madeso prices riseenergyprice ↑buyingcan makebuyingcan make

The old rulebook saw job losses and said “push spending up”, which was part of what fed the 1970s inflation, alongside the oil shocks. The new model says the opposite: when a supply shock pushes prices up, cool spending early and keep expectations calm, so inflation doesn’t feed itself. That costs some jobs, but far fewer than letting inflation run for years.

That’s roughly what central banks did in 2022, after a slow start. US prices were rising 9.1% a year by June 2022. To cool spending down, the US central bank raised its interest rate eleven times between March 2022 and July 2023, from almost 0% to about 5.25–5.5%. Other central banks did the same. That’s why loans got more expensive on purpose: when loans cost more, people and businesses borrow and buy less, so shops feel less pressure to raise prices.

The central bank also used the new idea from chapter 5. It said in public, months ahead, that it would keep raising its rate until inflation came down. Banks didn’t wait for those rises to happen. Because they could see where the central bank’s rate was heading, they raised what they charged for new home loans straight away, from about 3% at the start of 2022 to about 7% by late 2022, while the central bank’s own rate was still only about 3%. So people took out fewer loans and bought fewer homes within months, instead of the year or more the shower tap (the delay from chapter 2) usually takes.

That public promise worked on expectations too. Most people believed the central bank would get inflation back to 2%, so shops and workers didn’t pile on big “just in case” rises the way they had in the 1970s. Price rises slowed to around 3% a year by mid-2023 and kept easing, with no repeat of the 1970s decade. The rate rises were one reason, and the factories, ships and ports that move goods to shops getting back to normal after the pandemic was another. You’ll get to make this call yourself in round 3 of the game at the end.

Curious? Go deeperWhy not raise the rate to 5% all at once?

Because of the shower-tap delay, a central bank can’t see how much each rise has worked until months later. It also doesn’t know in advance exactly how high the rate needs to go. Jumping straight to a big number risks overshooting into a deep slump. That happened in the early 1980s, when rates of nearly 20% stopped inflation but left about 1 in 10 people out of work.

Very fast rises can also break things. A bank that lent money or bought bonds (loans to governments, paid back later) at the old, low rates now holds something worth less, because new ones pay more. In March 2023 a US bank, Silicon Valley Bank, collapsed partly because of such losses.

The public promise let the central bank have it both ways. Because everyone knew more rises were coming, loan rates jumped straight away, so it got most of the cooling early while keeping the choice to stop once it saw enough. Once it started, it moved fast: in 2022 it made four rises in a row of 0.75 each (for example from 1.5% to 2.25%), its biggest in decades. Many economists do say it started too late, in 2021.

The new models didn’t end booms and slumps, and central banks still get things wrong. Many were slow to raise rates in 2021, expecting the price rises to pass quickly.

Still, the Nobel committee points out that the pandemic and the recent energy crises did far less lasting damage than the 1970s, and that nothing like the 1930s depression, when about a quarter of US workers were out of work, has happened since. Recessions and bouts of inflation still happen, but in the committee’s words they are “less long-lasting”.

So next time you hear “the central bank raised rates”, a model built on Hall’s and Woodford’s ideas helped make that decision.

Curious? Go deeperWho are Robert Hall and Michael Woodford?

Robert E. Hall was born in 1943 in Palo Alto, California, and is a professor at Stanford University. Michael Woodford was born in 1955 in Chicopee, Massachusetts, and is a professor at Columbia University in New York. Both earned their PhDs at MIT. Woodford was woken by the call from Stockholm at 4:30 in the morning, on a day he was due to set his students an exam. In his interview with the Nobel Prize website he joked: “They’re probably hoping I’ll cancel the exam.”

Key idea

When a shock pushes prices up, the new model says to cool spending early and keep expectations calm. That’s why central banks raised rates in 2022, and it’s one reason inflation didn’t drag on for a decade as in the 1970s.

Quick check

Energy prices suddenly jump, and prices start rising everywhere. What does the new model suggest?

Recap

Remember these 5 things

If you remember nothing else from this lesson, remember this.

  1. The ride. The economy swings when people want to buy far less (slump) or far more (boom) than a country can make.
  2. The dial. A central bank steers spending with its interest rate: cheaper loans speed spending up, more expensive loans slow it down. The effect takes many months to arrive.
  3. The broken rulebook. In the 1970s, rules copied from past numbers failed, so economists set out to build models from how real people decide.
  4. Hall and Woodford. Hall showed that people change their spending when news changes what they expect. Woodford built the model, with shops that set prices looking ahead.
  5. Steering with words. So central banks steer with believable promises as well as the dial. That’s why rates went up in 2022, and one reason inflation didn’t drag on as in the 1970s.
Mini game

Steer the Town

You’re the central bank. Four rounds, four situations. For each one, choose what to do with the interest rate, or, once, what to tell the town.

Quick answers

Questions people ask about the 2026 Economics Nobel

Short, plain-English answers. Tap a question to open it.

Who won the 2026 Nobel Prize in Economics?

Robert E. Hall of Stanford University and Michael Woodford of Columbia University won the 2026 Sveriges Riksbank Prize in Economic Sciences in Memory of Alfred Nobel, “for microeconomic foundations of macroeconomic stabilisation”. It was announced on 12 October 2026. Their work underpins the models central banks use to set interest rates.

What did Hall and Woodford win the Nobel Prize for, in simple words?

They showed how to build a working model of a whole country’s economy from the decisions of ordinary households and businesses, especially what those people expect to happen. Hall showed that people change their spending when news changes their picture of the future. Woodford built the first complete version of the model central banks now use to set interest rates.

What does “microeconomic foundations of macroeconomic stabilisation” mean?

“Macroeconomic stabilisation” means evening out the booms and slumps of a whole country’s economy, mostly with interest rates and government budgets. “Microeconomic foundations” means building the model used for this from the bottom up: from how single households decide what to spend and how single businesses set their prices, instead of from patterns copied from past numbers.

Why do central banks raise interest rates when prices rise?

A higher interest rate makes borrowing more expensive and saving more rewarding, so people and businesses spend less. With less buying, shops feel less pressure to raise prices, and inflation slows down. The effect takes many months to arrive, so central banks try to act early. The cost is that jobs can suffer if they overdo it.

What is a New Keynesian model?

It is the kind of economic model almost every central bank uses today. It describes households that spend based on what they expect to earn, businesses that change prices only now and then and look ahead when they do, and a central bank that sets the interest rate. Michael Woodford’s 2003 book Interest and Prices set out the basic version.

Why do people’s expectations matter for inflation?

Businesses can’t change their prices every day, so when they do, they set them with the coming months in mind. If they expect costs and other prices to rise fast, they raise their own prices more, and inflation feeds itself. If they believe the central bank will keep inflation near its target, usually 2% a year, prices calm down faster.

What went wrong with the economy in the 1970s?

Oil prices jumped in 1973 and 1979, and prices and unemployment rose at the same time, which the models of the day said shouldn’t happen. Governments and central banks pushed spending up at the wrong moments, and high inflation lasted years. In the US it took interest rates near 20% around 1980 to bring it down, at the cost of a deep recession.

Is the economics prize a real Nobel Prize?

Sort of. Alfred Nobel’s will set up five prizes. The economics prize was added in 1968 by Sweden’s central bank, the Sveriges Riksbank, in his memory. It is chosen by the Royal Swedish Academy of Sciences and handed out alongside the others, so people call it the Nobel Prize in Economics.

Check your understanding

Common mix-ups

“Inflation means prices are high.”

Inflation is how fast prices are rising, in % a year. When inflation falls from 9% to 3%, prices are still going up, just more slowly. They rarely go back down.

“The central bank prints money and hands it out.”

Its everyday tool is the interest rate. Payments to households, such as pandemic checks, come from the government, not the central bank.

“My own bank decides my interest rate.”

Partly, but most of what banks charge and pay follows the central bank’s policy rate. When it goes up, variable-rate loans and savings rates usually follow within weeks.

“Raising rates stops inflation straight away.”

The effect takes many months, often a year or more, to arrive in full, like a shower tap that’s slow to change temperature. That’s why central banks try to act early.

“A recession means everyone loses their job.”

Most people keep their jobs. In a recession the economy shrinks for a while and unemployment rises, often by a few percentage points, which still means millions of people.

“The winners invented interest rates.”

Central banks have set interest rates for centuries. Hall and Woodford helped build the models that tell central banks how far to move the rate, and when, and why expectations matter.

Words you’ll hear in the news

Inflation
How fast prices across the board are rising, in % a year. About 2% counts as calm.
Recession
A slump in which the economy shrinks for a while and unemployment rises.
Central bank
A country’s “bank for the banks” (the Federal Reserve, the Bank of England, the ECB). It sets the main interest rate.
Interest rate
The extra you pay to borrow, or earn for saving, as a % of the amount each year.
Policy rate
The interest rate the central bank sets. Loan and savings rates mostly follow it.
Inflation target
The pace of price rises a central bank aims for, usually 2% a year.
Stabilisation policy
What central banks and governments do to even out booms and slumps.
Microeconomic foundations
Building a model of the whole economy from how single households and businesses decide.
New Keynesian model
The kind of model central banks use today: households and businesses that look ahead, sticky prices and a central bank setting the rate.
Sticky prices
Prices that change only now and then, because changing them costs time and money.
Output gap
How far buying is above or below what the economy can comfortably make.
Supply shock
Something that suddenly cuts how much the economy can make, such as an energy price jump.
Stagflation
A stalled economy and high inflation at the same time, as in the 1970s.
Forward guidance
A central bank saying in advance what it plans to do with interest rates.
Sources